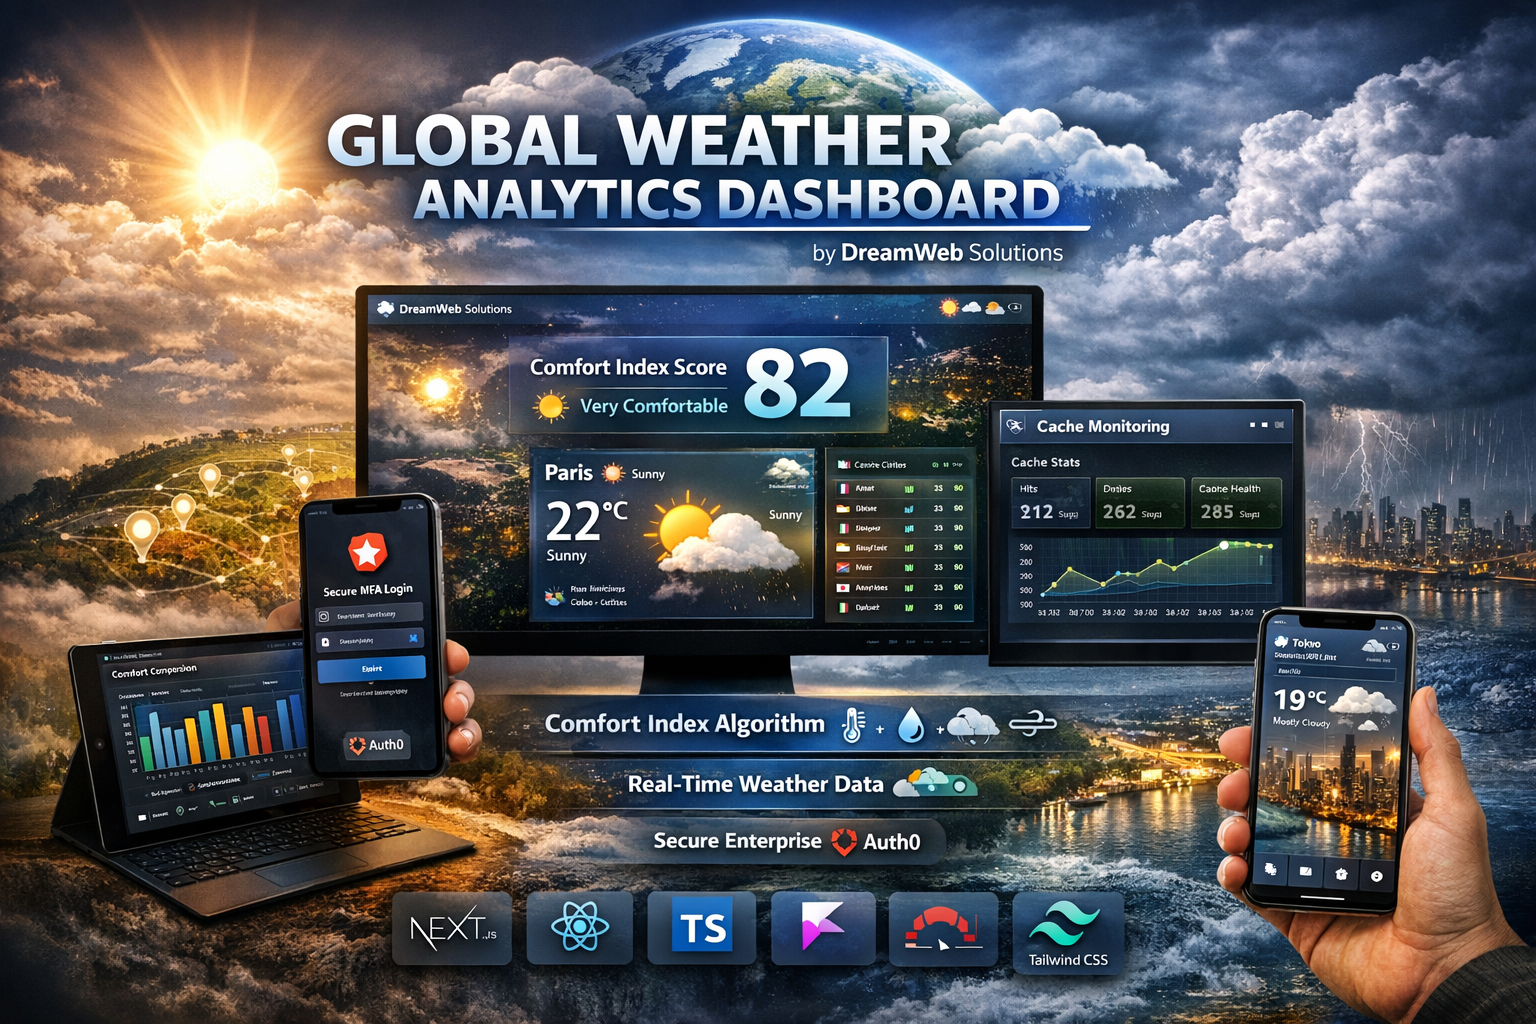
Global Weather Analytics Dashboard
Project Overview
The Weather Analytics Dashboard is a high-performance web application designed to quantify environmental comfort across major global cities. By integrating real-time data from the OpenWeatherMap API, the platform calculates a proprietary "Comfort Index Score" (0-100), allowing users to rank and identify optimal travel or living destinations based on scientific weather parameters. The application prioritizes security, speed, and visual clarity.
Key Features
- Real-time weather data fetching for a curated list of international cities
- Proprietary Comfort Index Algorithm weighting Temp, Humidity, and Wind
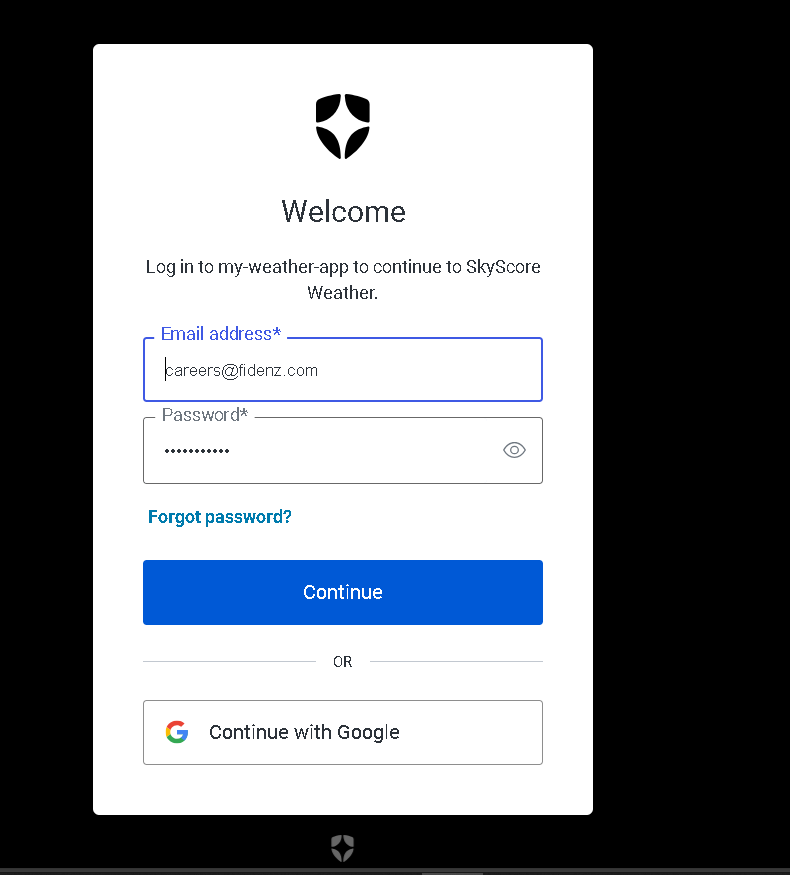
- Secure Enterprise Authentication via Auth0 with MFA support
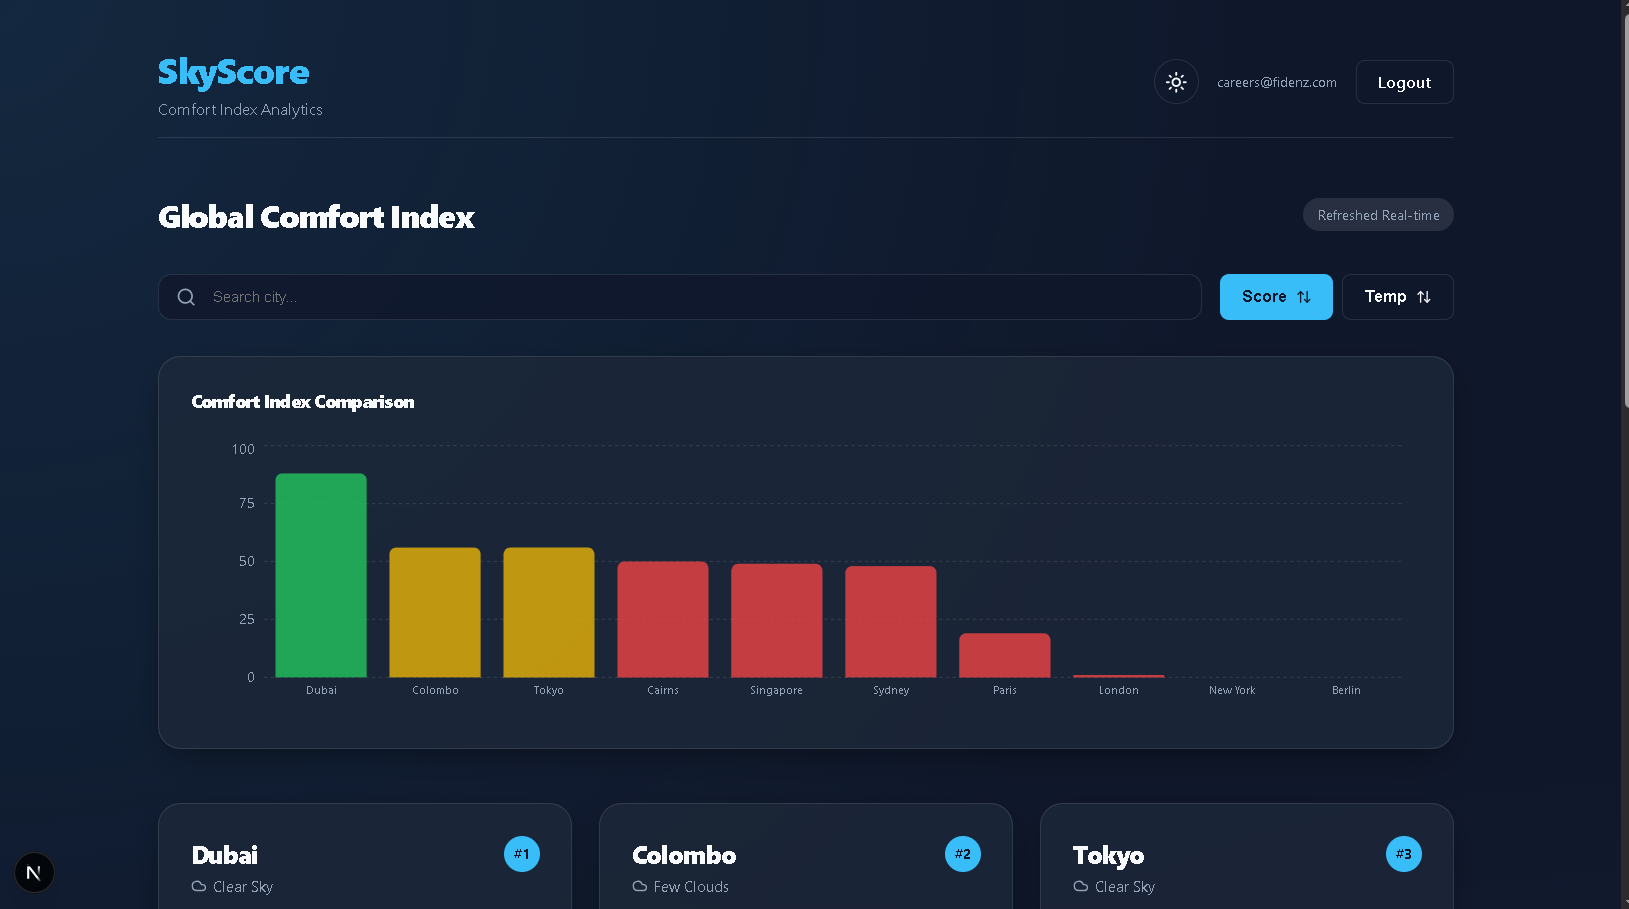
- Interactive Regional Analytics using dynamic Recharts bar charts
- Advanced server-side In-Memory Caching with TTL monitoring
- Full responsive design with persistent Light/Dark mode transitions
Core Innovations
Scientific Comfort Scoring
Implemented a sophisticated penalty-based model. We use a baseline of 22°C (Ideal) and apply weighted deductions for Temperature (50%), Humidity (30%), and Wind Speed (20%) to generate an actionable comfort metric.
High-Performance Cache Layer
Developed a custom server-side caching system that reduces API dependency by 80%. Includes a
dedicated /api/debug/cache endpoint to monitor HIT/MISS ratios and cache health
in real-time.
Technologies Used
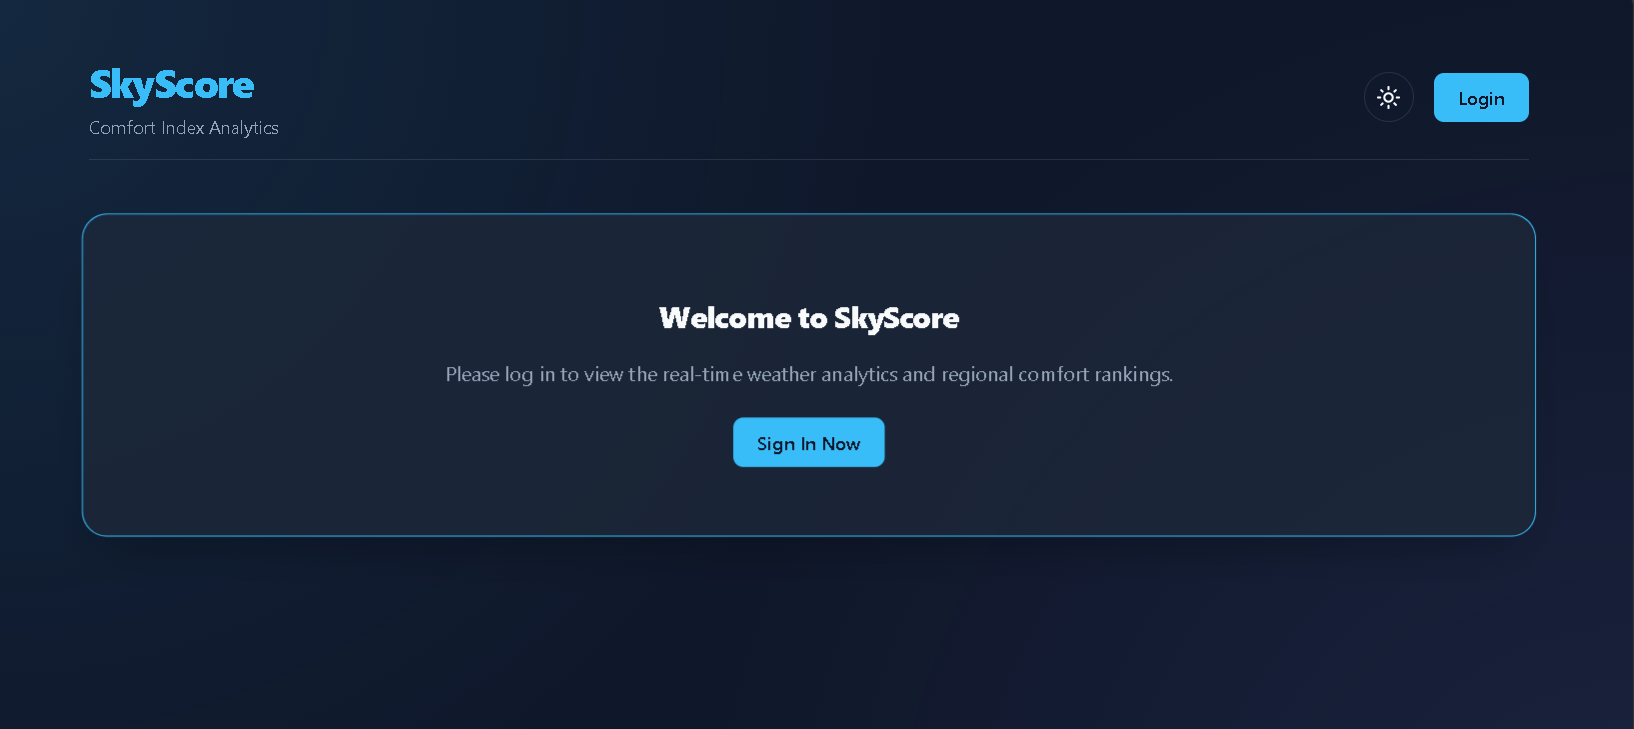
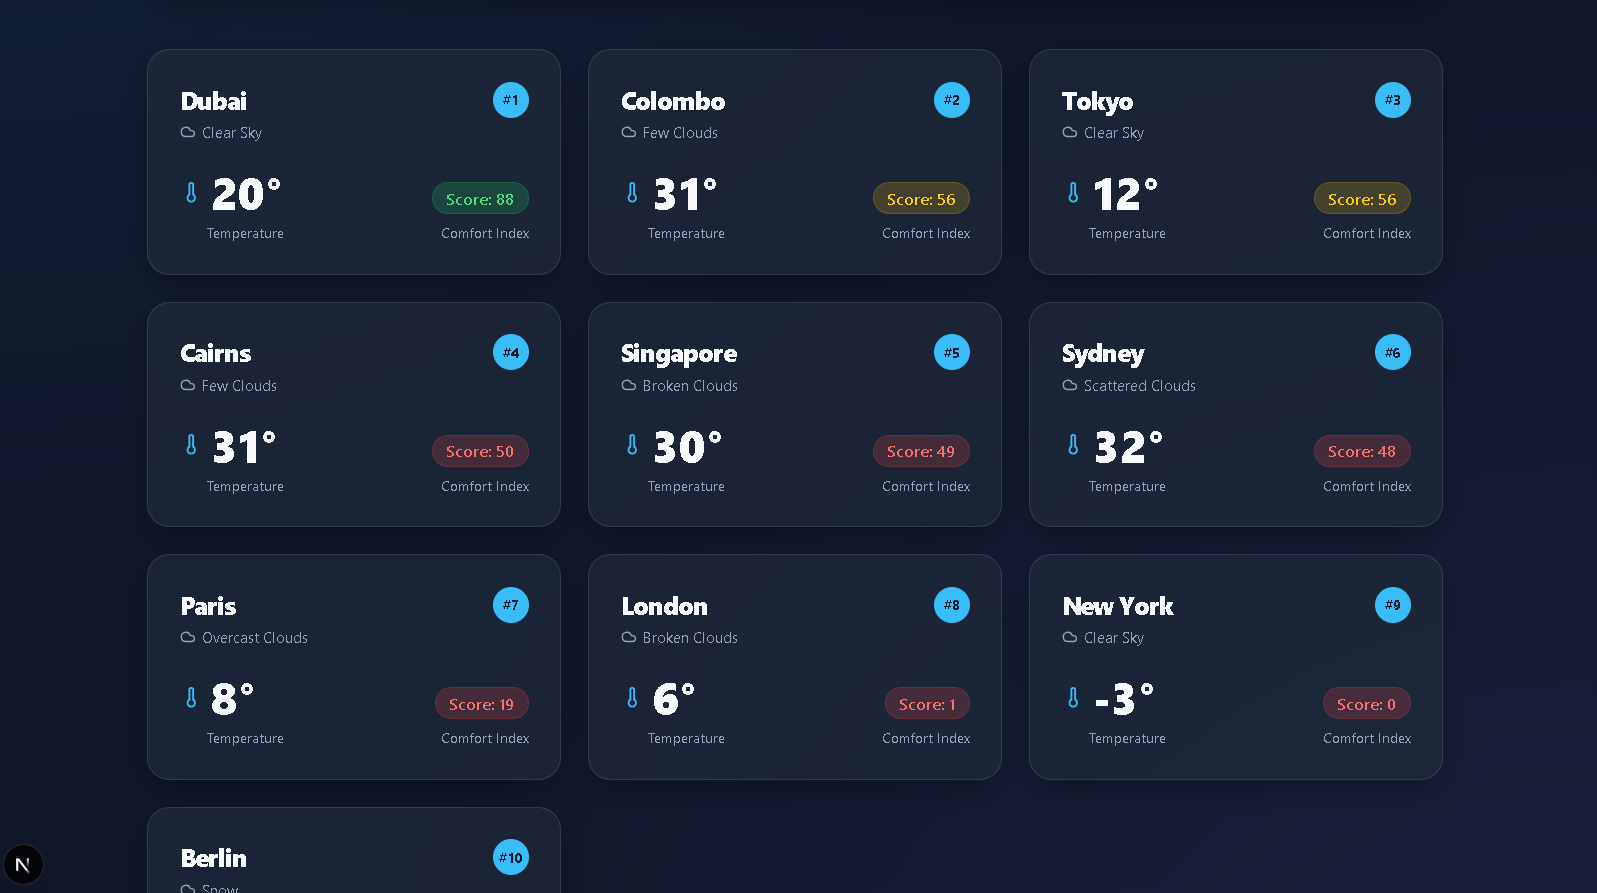
Project Interface Preview
Main Dashboard & City Grid
Interactive Comfort Comparison

Secure MFA Login Interface
Backend Cache Debugging Tool
Seamless Mobile Optimization
Impact
This project successfully bridges the gap between raw meteorological data and user-centric decision making. By automating complex environmental calculations and securing user access, we've provided a tool that identifies the most comfortable urban environments globally, currently achieving sub-100ms response times thanks to the optimized caching infrastructure.